
Reading the Swell Before It Arrives
I check the 5am forecast half-asleep — and the math behind it was written in 1947 to put landing craft on a beach under fire.
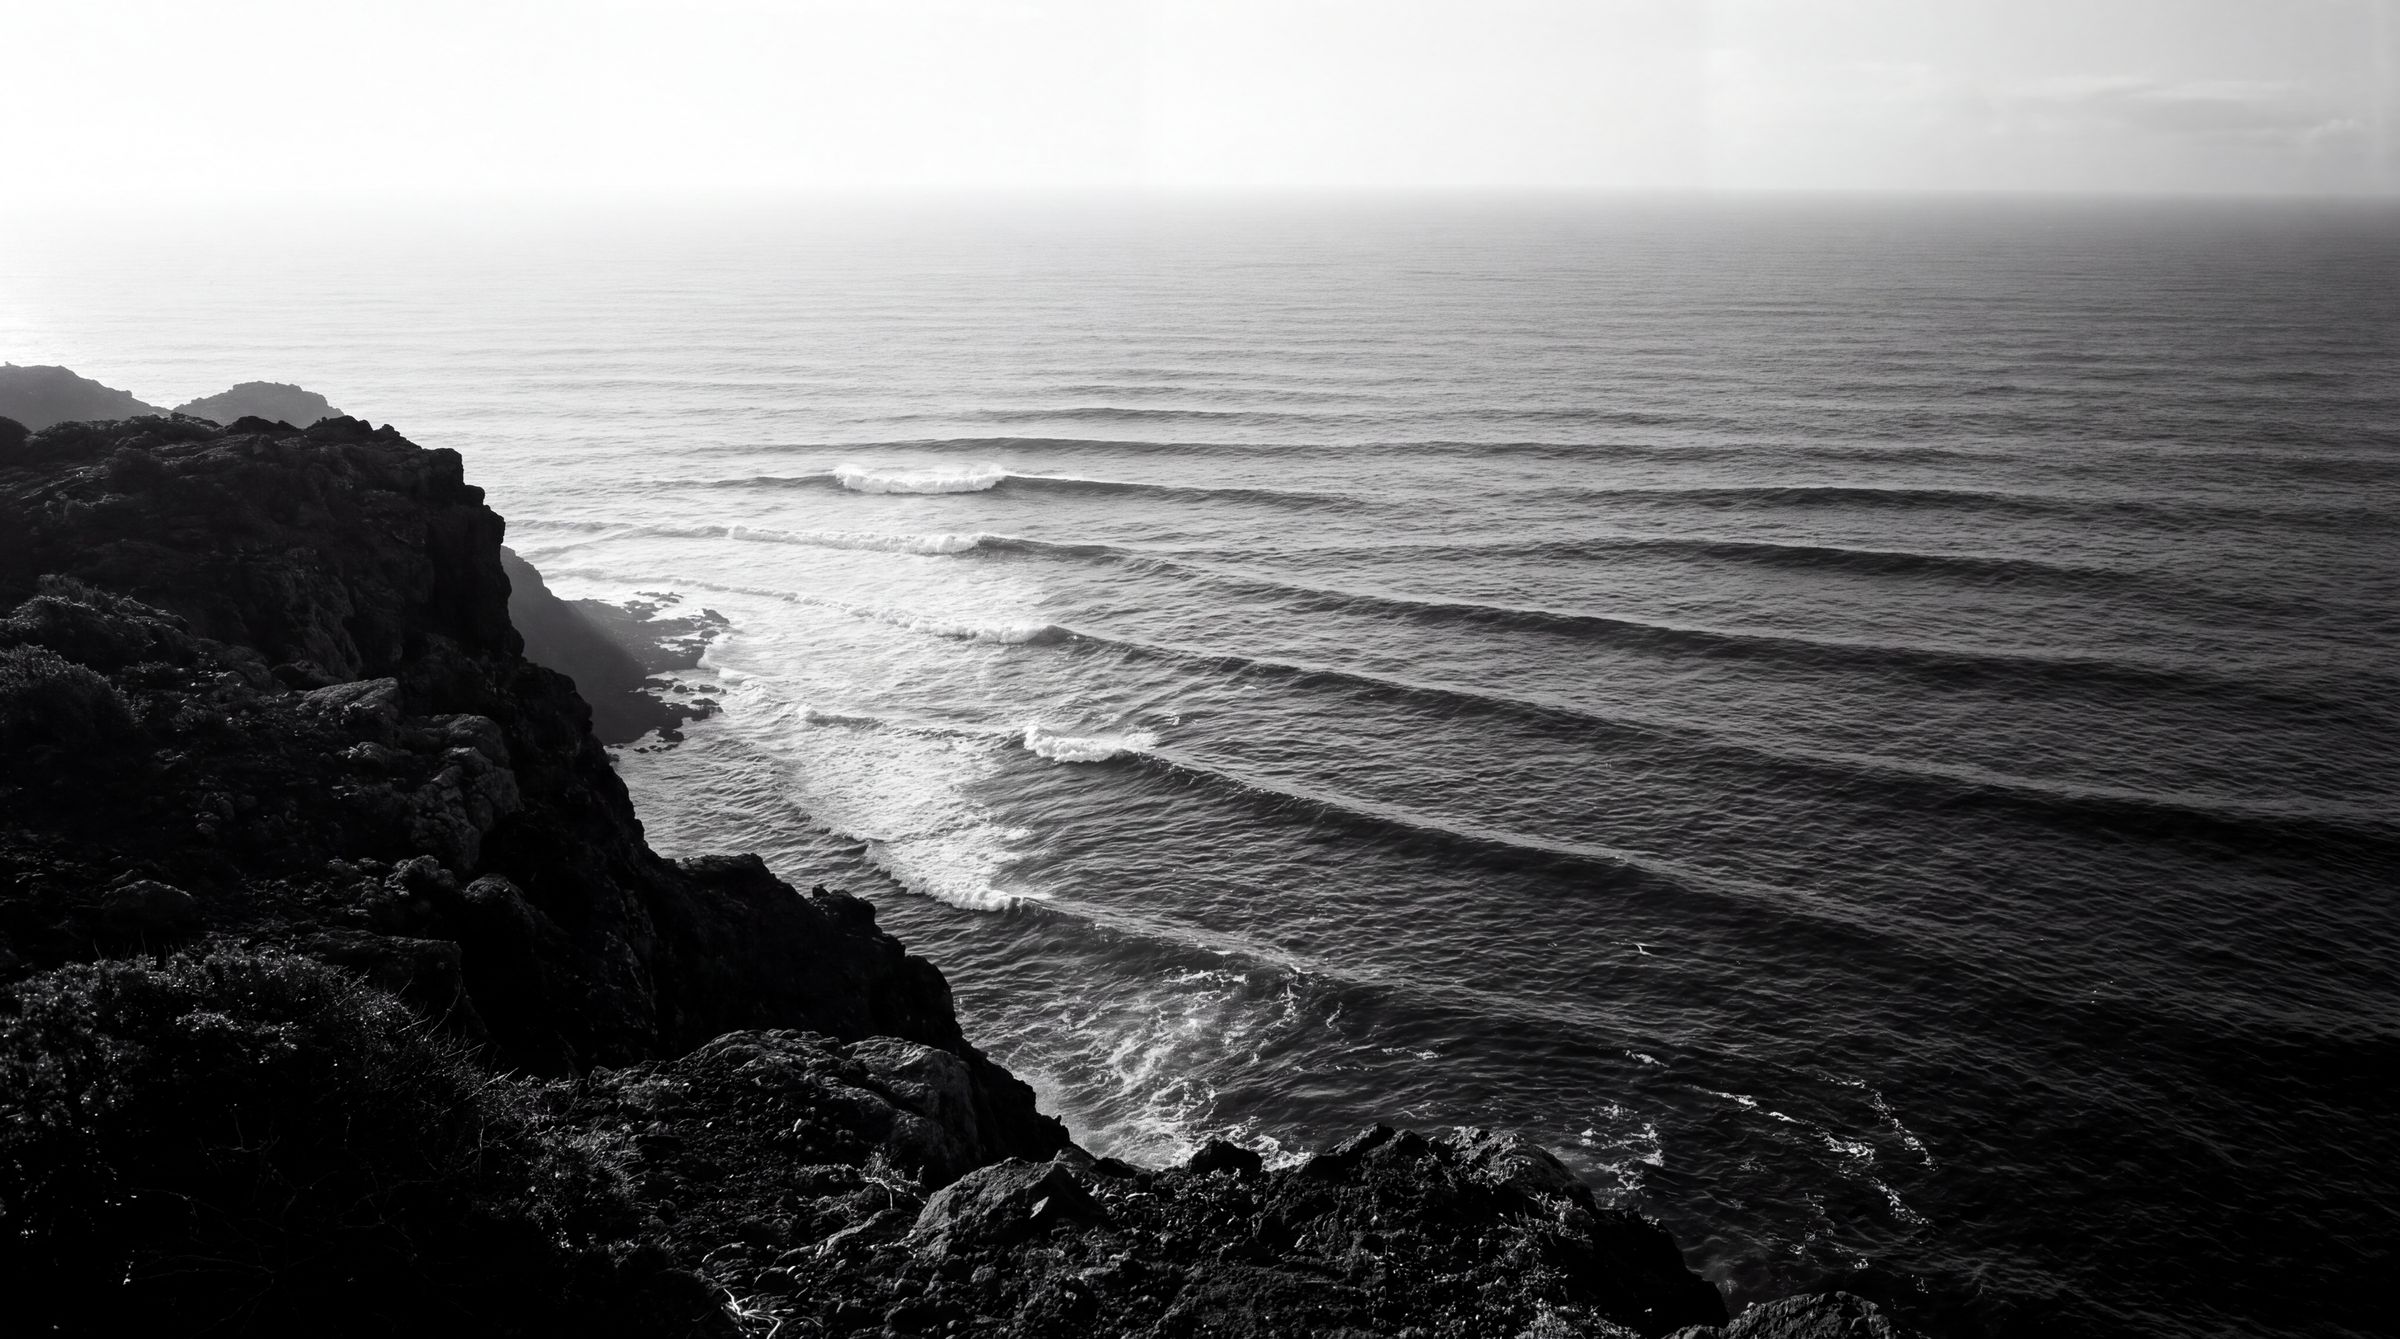
5am. The alarm, then the phone before my feet hit the floor. I open the forecast in the dark — swell height, dominant period, wind direction, the little animated arrows marching toward the Portuguese coast. Ericeira, mid-tide, 2.1 metres at 14 seconds out of the west-northwest. Coxos will have shape by seven. I know this before I have seen the ocean, before coffee, before the light. A glowing rectangle told me what the water is doing three hundred miles offshore.
That rectangle runs applied physics with a paper trail. And the trail starts with a war.
In March 1947 the U.S. Hydrographic Office published H.O. Pub. No. 601: “Wind, Sea, and Swell: Theory of Relations for Forecasting,” written by Harald Sverdrup and Walter Munk at Scripps Institution of Oceanography. That document is the origin of the number every surf forecast still leans on — significant wave height. Not the tallest wave. Not the average. A statistical measure of the sea state, the mean of the highest third, the figure that actually predicts what a coastline will feel.
Sverdrup and Munk did not write it to help anyone catch a wave. As the University of California’s own account of the wartime work describes it, the two developed the method from 1943, taught it to more than 200 Navy and Air Force weather officers at Scripps, and fed it into the planning for the amphibious landings at Sicily, Normandy, and across the Pacific. The joint US/British wave prediction for Normandy influenced Eisenhower’s decision to delay D-Day by 24 hours. Landing craft floated or swamped on the accuracy of a swell forecast. The math I check half-asleep was built to put men on a beach under fire.
Here is what the app is actually doing. Wind blows over open water and pushes energy into it — the longer the fetch, the harder and longer the wind blows, the more energy goes in. That energy sorts itself by wavelength as it travels. Long-period swell outruns short-period chop, which is why a clean 16-second groundswell arrives hours ahead of the wind slop that made it. Sverdrup and Munk turned that process into equations.
Modern forecasting turned the equations into a spectral model. NOAA’s original WaveWatch III sliced the sea into a spectrum: 25 frequency bands, each 1.1 times the one below it, across 24 directional bins of 15 degrees apiece. Every band carries its own energy, its own speed, its own direction. The model propagates each one across an ocean grid, hour by hour, and reassembles them into the height and period I read at dawn. The version running today is finer — tens of frequency bands sliced across dozens of directional slices, refined with each grid upgrade since. But the skeleton is 1947. Wind, sea, swell. Fetch, energy, period.
The surf apps add a layer on top. By Surfline’s own account of its own models, founder Sean Collins built LOLA in 2001 — the first swell model to pull satellite wave-height data in near-real-time and combine it with bathymetry and buoy readings, updating every six hours. Surfline later retired LOLA — the codebase, written in an older research-computing language, fell out of favour — and folded the best of it into LOTUS, which adds machine learning and updates hourly. The nearshore bathymetry is the part that matters to a surfer. A swell is only energy until it feels the bottom. The reef at Coxos, the way it stands a west swell up and throws it, is the last equation in the chain, and it runs on a map of the seafloor.
None of this replaces reading the actual water. The app told me 2.1 metres at 14 seconds. What it cannot tell me is that on the mid-tide push the Coxos takeoff shifts fifteen metres north, or that a 14-second period at that size means the sets come in fours with long flat gaps, or that the wind will swing sideshore by ten and shut the window. I have paddled out on a five-star forecast into a lineup already blown to rubble, and I have scored empty head-high barrels on a day the app rated two stars. The forecast is the paddle-out. The water is the wave.
But the forecast is not a guess. It is the compressed output of eighty years of oceanography — a wartime report, a spectral model, a satellite feed, a map of the reef — delivered to a phone in a dark kitchen. Reading it well is a craft, the same craft as reading a set stacking on the horizon. Both are physics you train yourself to see.
The swell icon is a convenience and a lie. Under it sit Sverdrup, Munk, a Navy publication number, and a coastline of landing craft. Check the forecast like it is nothing and you will surf like it is nothing. Read it like the physics it is, and you are already in position before the first set shows.
More from this domain
20 Aug 2026
OceanThe Wave That Never Reads You Back
A soliton is a wave engineered to never change. That is the point of Surf Ranch — and the exact reason it can teach a turn but never teach the ocean.
26 Jun 2026
OceanThe Fin Setup Nobody Owns
Every board at Ribeira d'Ilhas ran three fins this morning. Mine too. Simon Anderson drew that setup in 1980 and never owned a cent of it.

25 May 2026
OceanThe 90s Toothpick Was a Destructive Test
The 90s toothpick era was not a fashion trend. It was a destructive test — every millimetre shaved to failure. Volume is the verdict.